
A/B testing is generally used to select between two different variations of something (ex: email message), so that the winning version can be sent to the broader population. A/B testing is a comprehensive topic; we will go into it in-depth in a future blog post. In preparation for that post, we want to examine the idea of an A/B test confidence interval. It plays a big role in interpreting A/B testing results.
What is an A/B Test Confidence Interval?
An A/B test confidence interval (CI) estimates the range where the true difference in performance (e.g., conversion rates) between two groups is likely to fall, typically with 95% confidence. It helps assess the reliability of the results and determine if the observed difference is statistically significant. If the CI doesn’t include 0, the difference is likely meaningful; otherwise, it might be due to chance. Narrower CIs indicate more precise results, while wider CIs suggest greater uncertainty.
For example, the result of an A/B test might say “Variation B wins, with a 96% Confidence Level.” What does that mean? And how it is estimated?
Let’s look at an A/B test example above. Say there are two variations of email creative that we want to test. Suppose our desired outcome is more clickthroughs. We want to identify the email variation that generates better clickthrough rates using a small list. This way we can use the winner for a bigger campaign down the line.
Accordingly, we do the A/B testing with the two email variations, and we get the following results:
Table 1: A/B Testing Results
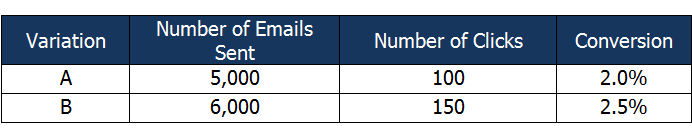
At first glance, Variation B appears to have done better. However, could this be due to random chance? This is always a possibility, considering there is a much a larger number of email contacts in this database, and the A/B test was done only on a small sample of it.
We look at the confidence level statistic to address this concern. Deriving it requires a few calculations, as follows.
Calculating Conversion for Confidence Level
In our example, conversion (represented by P) is calculated as:
P = Number of Clickthroughs / Number of Emails Sent
As shown in Table 1,
P (Variation-A) = 2.0% = 0.02
P (Variation-B) = 2.5% = 0.025
A/B Test Standard Error
The A/B test standard error (SE) represents the statistical accuracy of an estimate. In this case, the conversion rates we calculated.
The conversion calculation of each variation described above has a standard error associated with it. This is calculated using the following formula:
The A/B test standard error equals the square root of the conversion rate, multiplied by (1-conversion rate), divided by the sample size.
Expressed as a mathematical formula, it looks like this (SQRT stands for “square root of”):
SE = SQRT {P*(1-P) / Sample Size}
In our case, when we apply the formula to both our A and B variations, it looks like this:
SE (Variation-A) = SQRT {0.02(0.98) / 5000} = 0.00198
SE (Variation-B) = SQRT {0.025(0.975) / 6000} = 0.0020
(Read this article for more information on A/B standard error and related concepts.)
Now, we will use those two formulas in yet another formula to get an important number.
Significance of ZScore in Confidence Interval
A statistic, usually referred to as the “ZScore,” helps us to determine whether the conversions in the two variations are really different because there is a true difference, and not because of random chance. It is calculated using the following formula:
The ZScore equals ( the Conversion in Variation B minus the Conversion in Variation A), divided by the square root of (Standard Error of Variation A, squared, plus the Standard Error of Variation B, squared).
ZScore = { P (Variation B) – P (Variation A) } / SQRT { SE2 (Variation A) + SE2 (Variation B) }
Here’s how that looks using our example numbers to calculate the ZScore in confidence interval:
ZScore = {0.025- 0.02} / SQRT {0.002^2 + 0.00198^2} = 1.77
Estimation of Confidence Interval
The ZScore derived above can be roughly explained as the number of standard deviations between the Variation-A and Variation-B conversions. The greater the ZScore is, the more confident we are that the conversions we calculated in the two variations are actually different from each other.
We derive the confidence interval from a normal distribution curve (which can be used in cases with larger sample sizes of 1,000 or more.) Refer to a normal distribution probability table and you can derive the probability corresponding to ZScore of 1.77 is 0.96. The ZScore of 96 confidence interval means that we are 96% confident that conversion derived in Variation B is truly higher than conversion in Variation A. Yet another way of saying this is: There is only a 4% chance that conversions derived in the two variations are actually the same, as an after-effect of random chance.
Generally in the case of email A/B testing, a confidence level of 95% or above is recommended. Therefore, in our example, we can be very confident that using Variation B is superior for producing the intended outcome (clickthroughs), and so we can confidently use it for our broader campaign.
Hopefully, this overview has shed some light on the concept of a A/B test confidence level, standard error and ZScore.