TL;DR: Lifecycle marketing is a strategy that aligns marketing efforts with every stage of the customer journey—from awareness to retention and advocacy. Instead of focusing only on lead generation, it emphasizes tracking and optimizing performance across five key stages: Attract, Capture, Nurture, Convert, and Expand. By measuring the right metrics at each stage, marketers can improve efficiency, increase conversions, reduce churn, and drive more long-term revenue.
Introduction
In regards to analytics and reporting, marketers tend to focus on early-funnel leads and their conversion. That’s practical; generating enough qualified leads remains the #1 concern for many marketers and their organizations. However, there is much more useful information to be gained through careful reporting and analysis of key metrics at all stages of the customer lifecycle.
For example, it is marketing’s role to build awareness among prospects for the company and its products, so that the top of the funnel collects enough of those convertible leads. Similarly, marketing has a role to play in customer marketing that helps in retention and upsell.
A traditional sales funnel sketches the progressive relationship between buyer and seller from the sales rep’s point of view. The “buyer’s journey” is a recreation of the steps a buyer goes through as they move from sticking with the status quo to committing to change, to researching and then deciding on potential solutions, negotiation, purchase, and post-purchase – the entire lifecycle. Sales doesn’t get involved in this journey until fairly late in the process, but marketing can, and should be there for every step of the way.
With this broader B2B customer lifecycle marketing view under consideration, we’re going to review the five sequential stages in the B2B marketing lifecycle, and discuss the metrics for each that may give us the key insights we want. In Part 1, we cover the first two stages: Attract and Capture.
What is lifecycle marketing?
Lifecycle marketing is a strategy that focuses on engaging customers at every stage of their journey with your brand—from first awareness all the way through retention and advocacy—using targeted, timely messaging. Instead of treating all users the same, lifecycle marketing aligns your marketing efforts with where someone is in their relationship with your business.
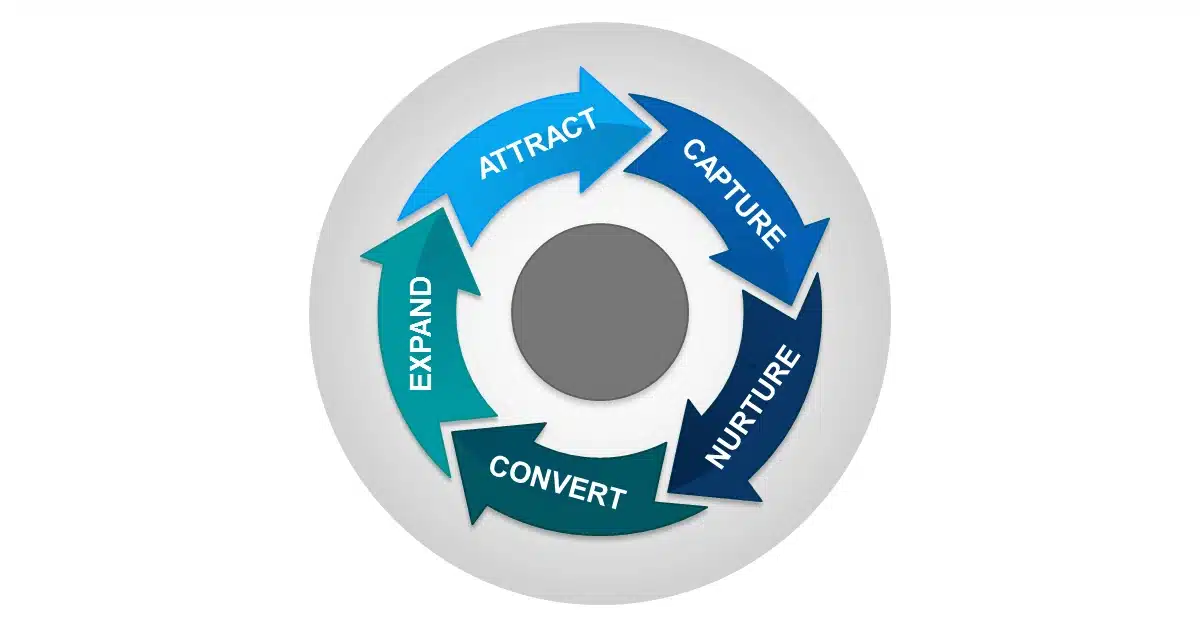
The five stages of lifecycle marketing
- Attract: Getting your brand and product/service known in the marketplace, and attracting people who may be interested.
- Capture: Capitalizing on the prospect’s initial attraction to you and gaining enough of the prospect’s information to start a new relationship.
- Nurture: Progressive communications to answer questions and educate the prospect while building trust and reinforcing need, so that the lead continues to consider buying from the product category in general – and your product in particular.
- Convert: The lead becomes a sales opportunity; you convince the lead to buy your product over both the status quo and your competition.
- Expand: This stage includes retaining your customer base, generating up sells, and inspiring advocacy.
At each stage there are factors you can measure that will let you evaluate how efficient your efforts are, so that you can improve them. Now, let us dive in to each lifecycle stage and explore the finer questions and key metrics that are relevant in each.
1. Attract
Lifecycle marketing starts with attracting relevant people to your company brand and products. The typical company uses some combination of content marketing, advertising, social media, tradeshows, media relations, and optimizes web efforts with search engine optimization.
Key questions you want to answer in this stage include:
- How many people visit your site?
- How attractive is your content?
- How popular is your brand?
To answer those questions, you need to select the metrics that are most relevant for your business and track them consistently, say monthly, to see a pattern. Consider:
- People visiting your web site: Track the number of individuals visiting your web site during the month. You can refer to external sources such as Google Analytics. (If you are an Act-On customer, this metric is provided in Act-On’s marketing automation platform.)
- Bounce rate: The percentage of visitors who enter your site and exit it on the same page – “bounce” – without visiting any other pages. By itself, bounce rate means little. If the time spent on your site is short, it could mean that your content did not engage them or was not what they were actually looking for. On the other hand, it also could mean that they were looking for just one quick thing and they found it (e.g., your address). If the time on the page is long, then the reader was definitely engaged, and found what they were looking for on this one page. Note that if your company name contains a very commonly looked for word (“deal”, “Gaga”, “Brazil”) you may get more bounces.
- Social media followers: For this metric, select a group of social media sites you are actively participating in and sum up the number of followers. Stick to the same sites as you track over time.
- Social shares: The number of shares in the given tracking period for each social media site you track.
- Number of pieces of new content on your site: This could include blog posts, web pages, white papers, webinar descriptions and registration forms, data sheets, and so on.
- Number of press releases that your PR department creates and distributes.
- Number of events that your company had an active presence in during the time period; these could be virtual or real-world.
- Google ranking: This is the most visible result of all your online activities. Pick a key word or phrase that is most relevant for your business (for Act-On, it is “Marketing Automation;” for NBA.com it would be “basketball”). Type that phrase into Google periodically and see where your site ranks. If your SEO/content efforts are consistent and more competitive than your competition’s, your company’s position will probably rise over time.
- Search volume for brand: Use Google Trends to check the trend in searches for your brand performed by people directly in the search engine. Studies indicate this is a convenient proxy for online brand awareness. Note that the values shown in Google Trends are dynamic – therefore, the individual values for a given month will keep changing, requiring historical updates. The real insight is from the trend line graph.
The bottom line for “Attract” lifecycle activities is to measure activity so you know what works to increase your visibility and share of audience, so you can make the best decisions about increasing the distribution and appeal of your content and brand.
2. Capture
Okay, you’ve attracted people to your website. Now what? Unless you find a way to get their contact information, you cannot start a dialog with them. That is where the “Capture” lifecycle stage comes in. The key questions you want to answer at this stage are:
- How many content consumers became known prospects?
- Which calls to action are the most effective? With which audiences?
- Which channels are the most effective in conveying messages?
Key metrics that help to answer these questions include:
- Conversion rate on Calls to Action (CTA): This number shows you the effectiveness of your CTA buttons in converting unknown visitors to known visitors through form fills.
- Cost per Click (CPC) and Cost per form fill: If you are using online advertising tactics like pay-per-click (PPC), these metrics are relevant.
- Number of net new prospects: The number of new prospects (from all sources) for the time period being considered.
- Leads by source: The lead source has a direct implication on the conversion potential of a lead. (Incidentally, tracking lead sources is another key benefit of using a marketing automation platform.)
You can determine the conversion rate of CTA by dividing the number of form fills (“submits”) by the number of unique views.
The bottom line at this stage is to know what’s working and what isn’t, so you can plan ways to increase known prospects in the sales funnel. These will become your leads.
3. Nurture
At this lifecycle marketing stage, the marketing team builds a relationship with the prospect; the goal is to nurture them into a Marketing Qualified Lead (MQL) that is ready to be handed over to sales team. The length of this stage, and the content deployed, is dependent on the average length of the buying cycle, the complexity of the sale, the nature of your product, and the type of buyer(s) you have.
For some companies, this stage may be 30 days; for others it can literally be a few years. The ability for a marketer to set up an automated program to manage nurturing at scale is a key argument for using a marketing automation platform. Such a program also helps you measure these activities, making it easier to determine results.
Some key questions at this stage are:
- Which automated programs are most effective in nurturing?
- Are there nurturing steps at which leads stall or drop out?
- Which activities are driving the lead scores up? Which show no effect?
- How many MQLs are created?
The metrics that matter include:
- Number of new leads: Prospects that are selected for active marketing. Your database should provide this information
- Number of reopened leads: These are older leads that had been labeled “not ready” (or something similar) and had been put into a drip program of some kind, which have recently demonstrated some kind of engagement that indicates growing interest
- Open rate, clickthrough rate of automated email programs: Open rates can be deceptive; as an example, if someone reads your email without enabling images, that read will not register as an open. Clickthrough rates are a better indicator of active engagement from an email recipient
- Lead score profile of new leads: This metric helps you observe lead quality over time. For this, identify all new leads opened in a month, and look at their lead scores at the end of the month. This could be a very valuable tool while communicating with sales reps (who tend to raise lead quality as an issue from time to time)
- Number of Marketing Qualified Leads (MQL): This is the target metric of nurturing programs; keeping track of it allows you to gauge effectiveness of nurturing programs. Note that it’s critical that sales and marketing together define the metrics that identify the MQL. If sales has input at this stage, it enhances their trust in lead quality and often results in better follow-up rates later
- Cost per MQL: The marketing program cost to create one MQL. This metric identifies the quantity-based cost efficiency of marketing programs, and is generated by dividing the program cost (which could include prorated labor and technology costs) by the number of leads generated. By itself, this metric can be misleading because it highlights marketing costs, but it gains more meaning later in the process when you can compare it to value generated
The bottom line at this stage is to generate more prospects ready to buy your product. If your lead generation and nurturing programs are improving, the percentage of leads that convert to MQL should increase also.
4. Convert
At this stage, all MQLs are screened and called on by sales. The goal is to convert them first to a Sales Qualified Lead (SQL) and then to a new customer. Marketing plays a vital secondary role, especially in creating mid-funnel and bottom-of-funnel communications that sales uses to convince the prospect that your product is the best suited for the prospect’s business needs. Examples of such communication might be an ROI calculator, or a chart showing how your product or service compares to the competition.
The key questions to be answered in this stage are:
- Which lead sources and campaigns are most effective in generating customers?
- How quickly are the leads converting?
- How many SQLs (“Opportunities”) are generated? How many new customers?
Some of the metrics that are helpful are:
- Number of SQLs: These are the number of leads that sales consider worthy of active pursuit based on several factors, including mutual fit
- Number of new customers
- Cost per SQL, Cost per new Customer: Marketing program costs rolled to these levels
- Campaign and Channel ROI: ROI can be calculated as 1-year sale value (bookings $) vs. marketing program costs. Here you might look at total costs, and also review ROI per channel and/or source
The bottom line at this stage is to generate more Sales Qualified Leads at a lower cost.
5. Expand
As mentioned earlier, gaining a new customer is not the end of your marketing activities. The new customer should be marketed to, especially with educational content, so that customer has the most successful adoption of your product or service better and gain maximum benefit from it. This in turn will make the customer more loyal to your product. It is estimated that gaining a new customer is 5 to 10 times more expensive than retaining a customer. This statistic highlights the need to hold on to customers as a good business practice, as it’s the most practical way to maximize the return on your investment in a customer.
Retention and corresponding marginal income (the difference between sales and the variable costs of the product or service) is not the only benefit from marketing to existing customers. You can enhance the possibility of upsells and cross-sells of products and services which can bring substantial amounts to company’s coffers; and you can increase advocacy from customers who will happily refer new business and provide testimonials. Since referral business usually costs less to acquire, has a shorter selling cycle, and often leads to larger deals, it’s particularly cost-effective.
The key questions to be answered at this stage include:
- What customer marketing programs and campaigns are the most effective?
- How successful are we in retaining and upselling to customers?
- How is the customer loyalty trending?
The corresponding metrics include:
- Open and clickthrough rates of customer campaigns: Select the email campaigns (especially automated campaigns) that target current customers and track the vital statistics
- Churn rate: Number of customers lost in the period divided by customer count at beginning of the period
- Upsell $ as % of Total Sales $: This reflects a company’s ability to upsell to current customers. For new companies, this will be a small percentage (10% to 30%) while for seasoned companies it will become closer to 50% or more.
- A loyalty metric such as Net Promoter Score (NPS): NPS is an effective metric to show how customer loyalty is trending. In addition to an overall indicator, NPS provides verbatim answers that can indicate the key areas to invest in for increased customer loyalty
The bottom line at this stage is to limit churn and generate more revenue from existing customers.
Wrap-Up
We hope we’ve given you ideas about how you can create or improve a reporting framework that reflects the entire marketing lifecycle. The recommended next step is to select key metrics for each stage (from the list provided or similar metrics that you think are better fit for your business) and begin to track them on a regular basis. Monthly cadence is highly recommended because it gives you advance warnings within a particular quarter which could enable you take timely corrective steps.