
Cohort analysis is an often-overlooked area of marketing analytics. It involves tracking a group that shares a common characteristic (a “cohort”) over a certain period of time and evaluating outcomes. In this post, we will talk about cohort analysis of leads. This involves following a group of leads which were created in a certain period, say a full quarter, until the leads become wins or losses.
A cohort analysis can provide important insights on which characteristics show that a lead has high potential for conversion to a win. These insights can then be used to determine which type of leads to focus on in the future.
While there are many ways to analyze cohort data, let us look into two areas that hold the most potential:
- Duration from lead to win (Velocity) by Lead Source, and
- Conversion from lead to win by Lead Source
In this scenario, “lead source” is the common characteristic for each cohort, which differentiates each from the other. We’ll be looking to answer two questions about time and volume: Which cohort showed the greatest velocity from creation to close? Which cohort showed the highest percentage of closed sales?
These two calculations are generally straightforward, and don’t require knowledge of advanced topics such as data mining. Most of the work can be done in Excel, and the resulting insights can be considered the low-hanging fruit of cohort analysis.
Our recommended approach is to perform the Velocity calculations first and focus on Conversion later (for reasons that will become obvious). Each component will require a unique approach to analysis.
1. Lead to Win Velocity
This analysis is to estimate the duration in days for a lead from Creation to Win. We recommend breaking this down further to two components:
- Lead Creation to Sales- Qualified Lead (SQL) stage, and
- SQL stage to Win
The first component is in the realm of marketing, while the second is the realm of sales. Therefore, it is good to have them differentiated. The goal of this analysis is to create a report similar to Table 1.
Table 1: Lead to Win Velocity Report

To derive such a report, we need to look at a cohort of new wins in a specific time period. We recommend a full quarter for this analysis because the cadence of wins varies within the quarter (usually light in the beginning and heavy towards the end). Accounting for the full quarter ensures that you bring in all types of wins, which gives you a comprehensive picture. The most recent full quarter is ideal because it gives you the most up-to-date measurements.
For the analysis, we need to create a data set containing new wins with the following information:
- Lead creation date (or Open date if it is more applicable to your business)
- SQL date (on which the lead became an SQL)
- Win date
Creating the above data set requires stitching together data from CRM and marketing automation systems. The process to do this will vary based your specific environment. (If you are an Act-On customer, you can easily do this analysis using the new Funnel Report, which we will discuss in the end).
It is expected that some of the win records may not have been populated with all the three dates mentioned above. If the sample size is big enough, select only the win records where all the dates are present and remove the rest. If the sample size is small, you can compromise on the “SQL date” because it is less critical than the other two.
The rest of the calculations are straightforward. Create two additional columns that derive duration in days from Lead to SQL and from SQL to Win. Then do a pivot table on Lead Source to derive average durations by Lead Source, similar to Table 1 above.
You will notice that some Lead Sources have shorter closing time than others. For example, you may see “referral” and “website” lead sources close faster than “virtual show” and “webinar”.
The overall averages are important because they are the headline messages to the marketing and sales teams, showing how long it takes on average for leads to become wins. A possible insight could be that “Leads generated in this quarter will close only in the next quarter or beyond.” This insight shows the wisdom of a long-term view for nurturing and conversion, which should lead to more appropriate, effective lead management, and be good for your business.
2. Lead to Win Conversion
To calculate lead to win conversion, one should start with a cohort of leads based on the creation date. Again, selecting a full quarter is recommended because the cadence of lead creation varies across the quarter and selecting a full quarter gives you a comprehensive picture.
Also, the selection of a specific quarter should also account for the fact that different lead sources take different durations to convert. If you select a more recent quarter, for example, it will favor lead sources that are faster-closing; lead sources that are slower closing will show fewer than their actual conversions. This is the reason we recommend doing the Velocity calculations before doing the Conversion calculation. A good rule of thumb is to select the full quarter one year ago as the cohort.
Once you select the cohort quarter, you have to create a data set containing all the leads created in that quarter and the status (as of now) on whether individual leads have become wins. For example, you may have 10,000 leads in the cohort and 200 of them have become wins. Your overall, average conversion rate by lead source is 2%.
This data set enables you to create a pivot report similar to Table 2 that provides conversion by Lead Source as well as overall conversion rate. You can compare the data to see which lead sources perform above and below the average.
Table 2: Lead to Win Conversion Report
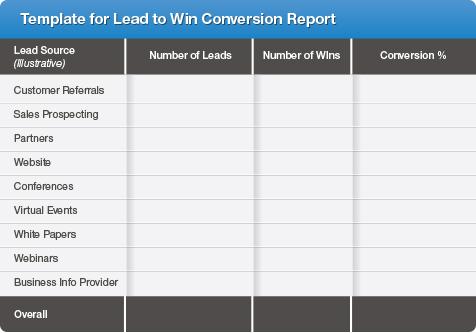
You can see that the above report can provide crucial insights for the marketing planning and budget allocation purposes. For example, you could try to get more leads from lead sources with higher conversion rates. This in turn guides you to prioritize marketing programs that support higher performing lead sources.
While such insights are helpful for planning, you don’t want to immediately stop the lower-conversion lead sources because they probably generate a lot of wins in absolute terms. Instead, you want to take a gradual approach to increase your investment in high-performing lead sources and decreasing investments in the lower-performing ones.
We also want to mention that the newly released Funnel Report in the Act-On platform enables you to generate Velocity and Conversion insights through a simple drag and drop interface. If you’re one of our customers, do check it out – you’ll get a lot of valuable insight with very little effort.
Hope this information is useful for your marketing planning purposes. Please provide your comments below!